
This post will describe how to install and configure Tobi Oetiker’s MRTG (Multi Router Traffic Grapher) on your Ubuntu server. All steps assume that the Apache http server is installed and operating correctly. Once configured, you’ll be able to use MRTG to monitor the traffic in and out of your network using the SNMP capability in your network’s gateway\router. MRTG generates static HTML pages containing PNG images which provide a visual representation of this traffic. MRTG typically produces daily, weekly, monthly, and yearly graphs. MRTG is written in perl and works on Unix/Linux as well as Windows. MRTG is free software licensed under the GNU GPL.
Software versions used in this post were as follows:
- Ubuntu Server v14.04 x64 LTS)
- mrtg_2.17.4-2ubuntu2_amd64
So, let’s get started.
Download and Install
First, update your package list:
sudo apt-get update && apt-get upgrade -y && apt-get dist-upgrade -y
Then download and install MRTG and Apache:
sudo apt-get install mrtg apache2
If this is the first time installing MRTG on your server you’ll likely be presented with the following message (See Figure 1). Answering “Yes” means that the MRTG configuration file will not be readable by others (file permissions set to 640). Answering “No” means that the file is readable by others (file permissions set to 644). In this example we’re going to accept the default Yes.
Figure 1:
![]()
MRTG installs a sample configuration file /etc/mrtg.cfg used to hold the SNMP information obtained from your gateway\router. For a full listing of what MRTG installs and where, run the locate command:
sudo updatedb && locate mrtg
Technically speaking, mrtg.cfg could remain in /etc, but just to keep things tidy let’s create a directory for it and move it into that directory:
sudo mkdir /etc/mrtg && sudo mv /etc/mrtg.cfg /etc/mrtg
That’s it for installing MRTG. Now let’s move on and configure it.
Configure
MRTG includes a script called cfgmaker that will help us populate /etc/mrtg/mrtg.cfg with the information obtained from your gateway\router. But before you run cfgmaker, you should setup the SNMP service in your gateway\router. This usually involves logging into your gateway\router and enabling SNMP. The default SNMP community name is typically “public.” If you change the SNMP community name to something else, make note of it. Now, run the following command, substituting your SNMP community name, if you’ve changed it, and adding the IP address of your gateway\router:
sudo cfgmaker --output=/etc/mrtg/mrtg.cfg public@your-router's-IP-address
If you would like to add more than one gateway\router to MRTG simply append the additional URL(s) to the same mrtg.cfg file. Then, when you build the web page using the indexmaker command described below, all the gateway\routers (and their associated graphs) will be displayed on the same HTML page.
sudo cfgmaker --output /etc/mrtg/mrtg.cfg public@the-first-router's-IP-address public@the-second-router's-IP-address
Next, open /etc/mrtg/mrtg.cfg and make sure under Global Configuration Options that the lines “WorkDir: /var/www/mrtg” (under Debian), and “Options[_]: growright, bits” (under Global Defaults) are uncommented. Finally, add the following lines to the existing line under the Global Defaults section:
EnableIPv6: no
RunAsDaemon: Yes
Interval: 5
What does all this do? The line RunAsDaemon: Yes will enable MRTG run as a daemon. This is beneficial because MRTG is launched only once, thus the parsing of the /etc/mrtg/mrtg.cfg file is done only once, not repeatedly as would be the case if one were to run MRTG as a cron task – another acceptable method for running MRTG. Also, when running as a daemon, MRTG itself is responsible for timing the measurement intervals; therefore, we need to add the Interval line option and assign it a value – in this example 5. This means that every five minutes MRTG will poll the SNMP service in your gateway\router and update its graphs. Finally, since many gateway\routers do not currently support SNMP over IPv6, we’ll retain the line EnableIPv6: no.
Speaking of graphs, by default MRTG graphs grow to the left, so by adding the option “growright” the direction of the traffic visible in MRTG’s graphs flips causing the current time to be at the right edge of the graph and the history values to the left. We’ve also chosen the “bits” option, which means that the monitored traffic values obtained from your gateway\router are multiplied by 8 and displayed bits per second instead of bytes per second.
Okay, now it’s time to create the web pages which display the MRTG graphs using the indexmaker command. Run the following commands:
sudo mkdir /var/www/mrtg

sudo indexmaker --output=/var/www/mrtg/index.html /etc/mrtg/mrtg.cfg
Open /etc/apache2/apache2.conf and add the following lines in the section containing similar Directory directives:
Alias /mrtg "/var/www/mrtg/"

< Directory "/var/www/mrtg/">

Options None

AllowOverride None

Require all granted

< /Directory>
Not: Remove space from Directory words
Then restart Apache:
sudo service apache2 restart
When restarting Apache you may receive a warning concerning its inability to “…reliably determine the server’s fully qualified domain name…” This non-critical error can be fixed by adding the following line to /etc/apache2/apache2.conf:
ServerName locahost:80
MRTG has been configured. Let’s start it up and see what it displays.
Start
There’s something important to keep in mind when starting MRTG, and that is that MRTG requires the environmental variable “LANG” to be C in order to run properly. Since most Linux systems these days, including Ubuntu server, use UTF-8 (run echo $LANG to see what your system uses), let’s change LANG to C and start MRTG using the following command:
sudo env LANG=C /usr/bin/mrtg /etc/mrtg/mrtg.cfg
When you run MRTG for the first time you may see a lot of complaints about missing log files. No worries, this is normal for the first 2-3 times you start MRTG this way. If, however, it continues to complain you may want to look into the source of the problem.
Well, that’s it. Now point your browser to http://your-server-address/mrtg and you should see a page that resembles Figure 2. You may have more or less graphs depending on the number of interfaces reported by your gateway\router(s).
Figure 2:
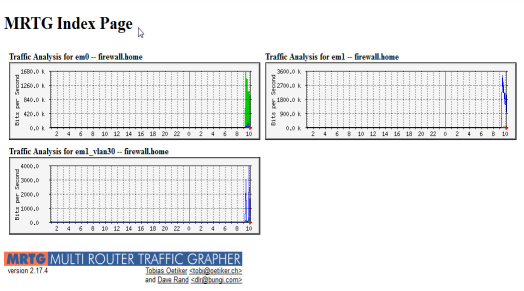
Because of the aforementioned option in /etc/mrtg/mrtg.cfg, you’ll see the graph starting “grow” to the right as the traffic is monitored over time, and the Y axis displayed as bits per second. If you click on any one of these graphs you’ll be taken to another page showing individual graphs for 30 minute, two hour, and daily averages, along with the maximum, average, and current bit rate in and out of that particular interface. Only interested in displaying one particular interface? Want to graph other SNMP data? No worries, just remember to run indexmaker again to update the MRTG index.html file.
Okay, so now that we have MRTG installed, configured and running let’s move on and discuss how to keep it running.
Operate
Starting MRTG by hand is not ideal in the long run. So perhaps after you’ve done some tweaking on MRTG and are satisfied with the results, you can automate the process of running MRTG by using a startup script in your system startup sequence. Here’s the script that I use:
#! /bin/sh

### BEGIN INIT INFO

# Provides: mrtg

# Required-Start:

# Required-Stop:

# Default-Start: 2 3 4 5

# Default-Stop: 0 1 6

# Short-Description: mrtg init script

# Description: This file is used to start, stop, restart,

# and determined status of the mrtg daemon.

# Author: [email protected]

### END INIT INFO

### START OF SCRIPT

set -e

# PATH should only include /usr/* if it runs after the mountnfs.sh script

PATH=/sbin:/usr/sbin:/bin:/usr/bin

DESC="mrtg"

NAME=mrtg

DAEMON=/usr/bin/$NAME

DAEMON_ARGS="/etc/mrtg/mrtg.cfg"

PIDFILE=/etc/mrtg/$NAME.pid

SCRIPTNAME=/etc/init.d/$NAME
# Exit if the mrtg package is not installed
[ -x "$DAEMON" ] || exit 0
# Load the VERBOSE setting and other rcS variables
. /lib/init/vars.sh
# Define LSB log_* functions.
# Depend on lsb-base (>= 3.0-6) to ensure that this file is present.
. /lib/lsb/init-functions
# Function that starts the mrtg daemon
start()
{
env LANG=C start-stop-daemon --start --quiet \
--exec $DAEMON -- $DAEMON_ARGS
}
# Function that stops the mrtg daemon
stop()
{
start-stop-daemon --stop --quiet --retry=TERM/30/KILL/5 \
--pidfile $PIDFILE
}
case "$1" in
start)
log_daemon_msg "Starting $DESC"
start
case "$?" in
0) log_end_msg 0 ;;
1) log_end_msg 1 ;;
esac
;;
stop)
log_daemon_msg "Stopping $DESC"
stop
case "$?" in
0) log_end_msg 0 ;;
1) log_end_msg 1 ;;
esac
;;
restart|force-reload)
log_daemon_msg "Restarting $DESC"
stop
case "$?" in
0|1)
start
case "$?" in
0) log_end_msg 0 ;;
1) log_end_msg 1 ;;
esac
;;
esac
;;
status)
status_of_proc "$DAEMON" "$NAME"
;;
*)
echo "Usage: $SCRIPTNAME {start|stop|status|restart|force-reload}"
;;
esac
exit 0
### END OF SCRIPT
To use the script, save it to your home directory as mrtg and make it executable. Then move or copy it to /etc/init.d:
cd ~

chmod +x mrtg

sudo mv mrtg /etc/init.d/
Now, link the mrtg script to all of Ubuntu server’s multi-user run levels (2-5):
sudo update-rc.d mrtg defaults
Now, let’s start MRTG using our script. If it’s currently running then substitute restart for start in the following command:
sudo service mrtg start
That’s it. Now if for some reason your server is rebooted, MRTG should fire up automatically. If you would like to remove the MRTG script from the server’s multi-user run levels, use the command: sudo update-rc.d -f mrtg remove
Conclusion
This concludes the post on how to install and configure MRTG on Ubuntu server. As you can see, MRTG isn’t terribly complicated and proves to be a really nice open source package for monitoring and displaying traffic in and out your network from virtually anywhere you have a web browser. For a full list of all the configuration options and other information I encourage you to visit the MRTG web site.
![]()